This blog post first appeared on Bloomberg's What Works Cities blog.
Creating goals and analyzing data led staff from Createch, a teen program at the Saint Paul Public Library, to uncover an unanticipated challenge in serving their patrons—that fewer girls than boys were accessing services—and paved the way for identifying unexpected solutions.
As part of the City of Saint Paul’s participation in the national What Works Cities initiative, Saint Paul’s Innovation Team, opens a new window is focused on finding ways to use the data we collect to improve our service performance for residents. The Saint Paul Public Library focused on setting goals and tracking data for a teen program called Createch, opens a new window. Through this work, I was able to identify a problem I didn’t know we had and develop a solution that is benefiting our teens. This situation illustrated how data can enhance the decisions we make to improve patrons’ experience while also demonstrating that we are transparent and accountable to the public and open to opportunities to innovate and improve.
Identifying Goals for Createch
Createch is a tinkering space where teens can hang out, mess around, and geek out with technology. Open after school five days per week, Createch comprises Createch Studio and Createch Labs that offer similar “making” programs to teens at five other locations one night each week.
At first, it was difficult to identify measurable goals for Createch. While we have clearly defined goals for Createch, they include things like fostering a culture that prioritizes equity, inclusion, and youth leadership and providing access to tools, technology, and people that support learning, self-expression, creativity, critical thinking, and innovation. It wasn’t until we were encouraged to define our goals without worrying beforehand about whether the goals were measurable that I was able to find meaningful, measureable targets.
Luckily, Createch had been through an improvement cycle and had created a solid improvement plan. Through an iterative process and with a lot of help from What Works Cities and the local Innovation Team, we identified our goals, and broke down those goals into sub-goals (and, if needed, we broke the sub-goals into activities). These smaller sub-goals illuminated a way to measure each of our large goals.
Creating a Sense of Belonging
One of our large goals is for teens to feel a sense of belonging in Createch, and a sub-goal of that is to increase repeat visitors to Createch.
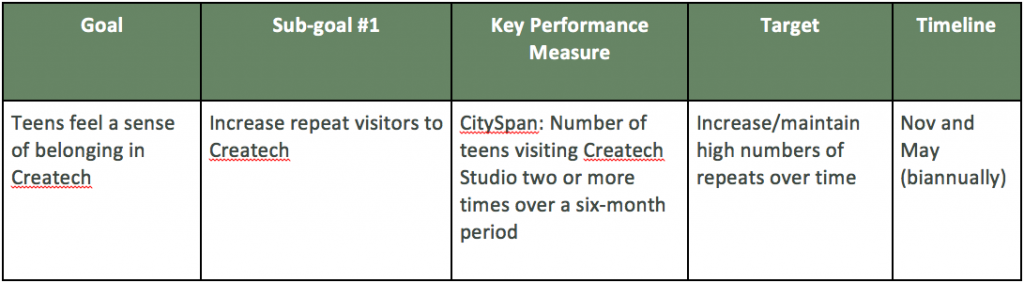
Next, we identified our target and our key performance indicators. What number or attribute did we hope to attain, and how would we measure that? How would we recognize success when we had it? We kept asking ourselves, “If we meet this target, will it illustrate that we met our goal?” We realized we could rely heavily on data already being collected. The attendance tracking system used in Createch allowed us to sort teens who visited Createch Studio two or more times over a six-month period.
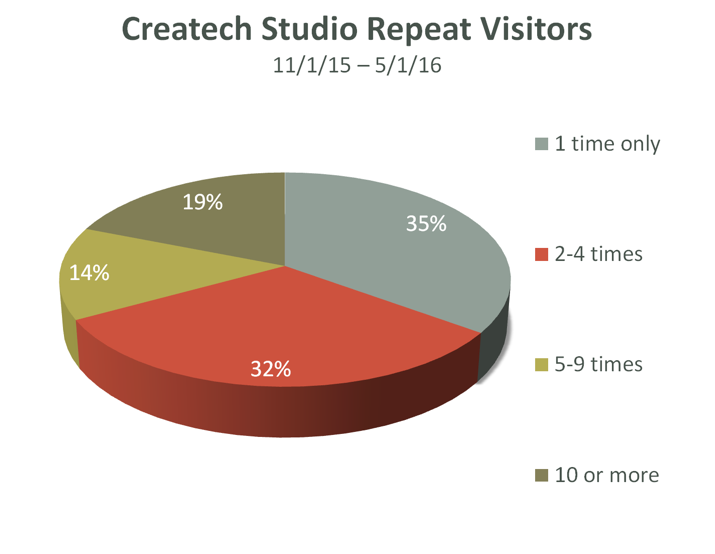
Once we pulled the data, we made it visual to share with staff and key supporters of Createch (at the same time providing Createch staff with baseline data to see trends over time). And once we visualized the data, we became more ambitious about our target: Though we aim to see teens come to Createch at least twice, our hope is to increase youth coming repeatedly: 5–9 and 10 times—or more!
Fostering Inclusion and Equity
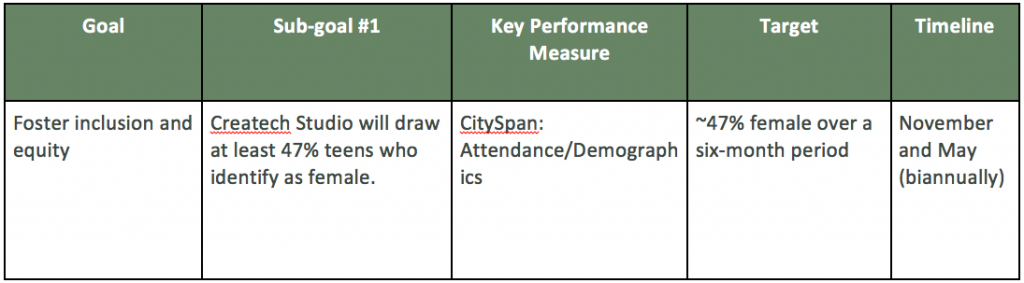
Another example of a large, and hard-to-measure, goal we identified is to foster inclusion and equity. Once we broke this down and identified the sub-goal—drawing at least 47% teens who identify as female—we arrived on a meaningful measurement using the demographics of teens attending Createch Studio.
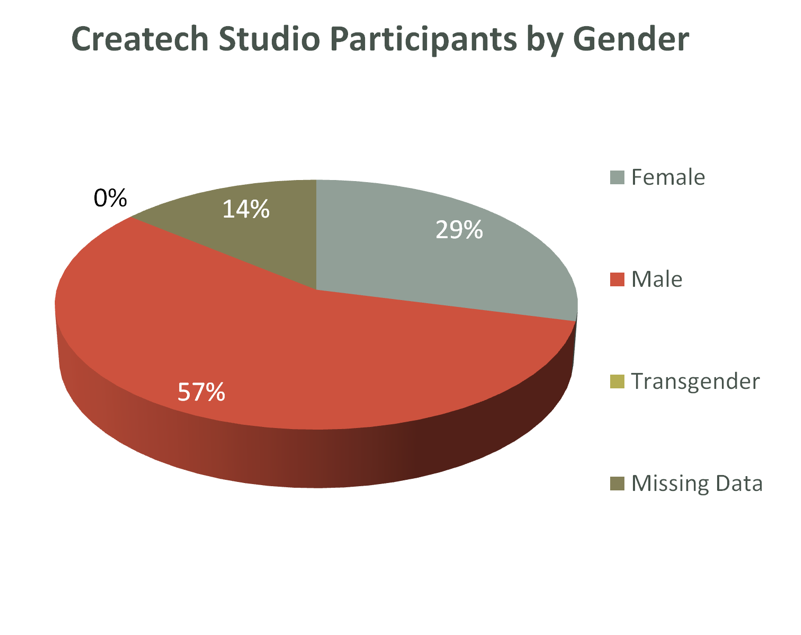
We found these data were collected and could be used to identify current performance. We put participants by gender into a pie chart to analyze results between November 1, 2015, and May 1, 2016.
 An Unexpected Discovery Shows the Way Forward
The data about participants’ gender led to a big “aha moment”—that far fewer girls than boys were attending Createch Studio. We hadn’t realized how stark the discrepancy was before we pulled the data and analyzed it. Because of the data, Createch Studio staff have added a successful “Girls’ Night,” when only girls are allowed in the space. During the first evening, the girls told the staff that they appreciated having the space to themselves and having control over the music played. Staff have reported girls getting into the recording studio more, playing more video games, and coming to the center more often. One staff member reported, “We’re seeing more girls now—they are feeling like it’s their space now.” The staff are continuing to look at ways to make the space more accessible and comfortable for girls, including by rotating the music selection to grow gender equity.
In all, we learned that collecting data will make Createch stronger. Createch staff now have clear goals on how to improve service to teens and a timeline to execute our goals. We plan to pull out and look at statistics biannually (in November and May), in addition to our half-day retreat in January, when we will revisit the data and make an improvement plan for the upcoming months.
Additional Resources
View Createch’s entire goal tree, opens a new window.
View Createch’s presentation on its findings, opens a new window.
For further reading on difficult-to-measure goals around working with youth, check out Sara Ryan’s article in the spring 2016 edition of Young Adult Library Services (YALS), “Tell the Story: Use Outcomes to Show the Difference Your Program Makes, opens a new window.”

Add a comment to: Improving Createch: When data led to an “aha moment” in Saint Paul